


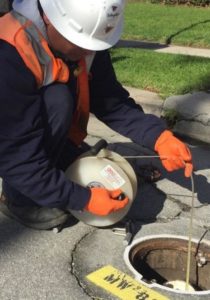

The presence of LNAPL and the characterization of LNAPL in the subsurface is often determined primarily by the measurement and observation of LNAPL in monitoring wells. It is noted, however, that the relative measure of apparent thickness of LNAPL in a well, while indicative of LNAPL presence, has been shown to be a poor indicator of the magnitude, mobility or recoverability of LNAPL in the vicinity of the well. Therefore, the investigator is encouraged to develop a thorough understanding of the LNAPL conditions.
Some of the many site-specific factors that may significantly affect LNAPL migration and recoverability are as follows:
- Soil/rock texture, pore size and geometry;
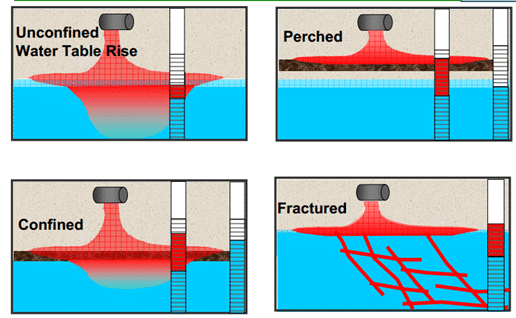
- Hydrogeologic factors such as pore water content, hydraulic conductivity, water table fluctuations, and aquifer type (e.g., confined, unconfined, perched, fractured bedrock, etc.);
- Fluid properties such as fluid density, viscosity and interfacial tension;
- Soil-fluid interaction properties such as capillary pressure and relative permeability; and site specific variability of these properties (e.g., heterogeneities).
Migration of LNAPL
When petroleum LNAPL is discharged onto or into the ground, it migrates downward under the force of gravity through the unsaturated (vadose) zone. As the LNAPL migrates through the vadose zone, some of it will be left behind, sorbed, trapped and immobilized in the pores by capillary forces and geologic heterogeneities. If a sufficient volume of petroleum is released, LNAPL can reach the saturated zone (capillary fringe and water table), where it will begin to accumulate and spread laterally because of its lower density and immiscibility with respect to water. Under sufficient head pressure, the LNAPL body may infiltrate the capillary fringe and effectively depress the water table. LNAPL will continue to migrate vertically and horizontally until equilibrium is reached, displacing air from pore spaces within the vadose zone and some of the water from the larger pores in the saturated zone.
After the release has stopped, the spread of the LNAPL body is spatially limited by forces that counteract the force of the LNAPL gradient including LNAPL buoyancy and capillary forces. There are two general stages in the development of the LNAPL body at the saturated zone after a subsurface petroleum release: 1) the initial, shorter duration expansion stage when the LNAPL is actively migrating under a sufficient LNAPL gradient; and 2) a much longer duration stable stage when migration is minimal to nonexistent after the hydraulic forces driving LNAPL migration have diminished relative to counteracting forces. However, if there are changes in these forces, such as water table elevation or gradient changes, LNAPL plume stability can change both horizontally and vertically.
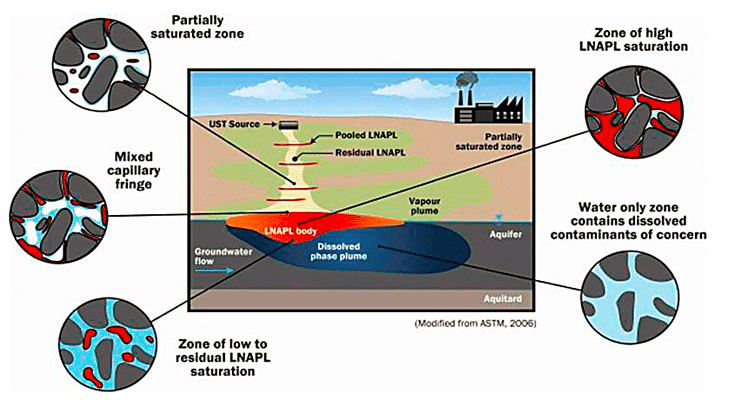

Figure 1: LNAPL saturation at pore scale
LNAPL Saturation
LNAPL body behavior can be characterized based partly on the LNAPL saturation. LNAPL saturation is defined as the percentage of total pore volume occupied by LNAPL (figure 1). In the vadose zone, LNAPL shares pore space with both air and water (present as soil moisture). In the saturated zone, LNAPL shares pore space only with water. Under vertical equilibrium, higher LNAPL saturations are usually observed near the top of the LNAPL body and the saturated zone, and the relative amount of LNAPL in the pores generally decreases with depth below the capillary fringe and/or water table. The change in LNAPL saturation with depth is referred to as the saturation profile.
The saturation profile can be irregular and can vary spatially due to stratification and other soil heterogeneities. The saturation profile also changes over time as the LNAPL is re-distributed by water table fluctuations. Vertical redistribution of LNAPL due to water table fluctuations often results in a LNAPL ‘smear zone’ of a thickness that is equal to or greater than the historical range of water table fluctuations. Water table fluctuations may control the appearance and disappearance of LNAPL in a well, and may significantly impact migration potential, recharge rates and recoverability.
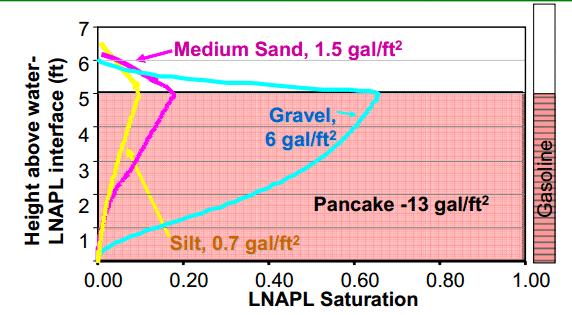

Figure 2: Saturation profile for different soil type (assuming in homogeneous soil)
Some of the LNAPL will eventually become hydraulically isolated leaving independent globules of LNAPL differentially trapped in pores and/or geologic irregularities. Residual LNAPL saturation is defined as the LNAPL saturation under which the LNAPL is “immobile under the applied gradient”. LNAPL below residual saturation is neither mobile nor hydraulically recoverable; although the technology that changes the LNAPL physically or chemically may be capable of increasing contaminant mass recovery. LNAPL exceeding residual saturation is referred to as mobile LNAPL. Mobile LNAPL may or may not be migrating, but it is potentially recoverable in the liquid phase.
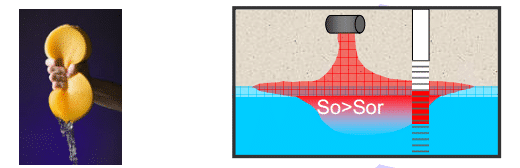

Figure 3: LNAPL saturation > residual saturation
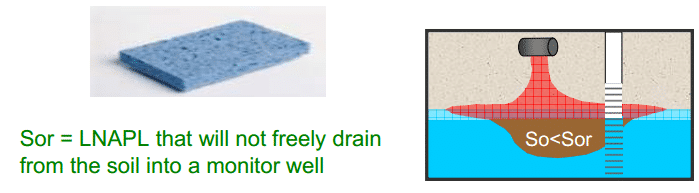

Figure 4: LNAPL saturation < residual saturation
LNAPL Detected in Monitoring Well
The presence of measurable LNAPL in a given collection point indicates potential mobility in the vicinity of the collection point, but it does not necessarily mean that the LNAPL body is migrating. For migration to occur at the edges of the LNAPL body, the forces that drive lateral LNAPL migration, such as the LNAPL gradient (head), must overcome the pore entry pressure. At some point at the leading edges of the LNAPL body, counteracting forces prohibit further LNAPL migration in the absence of a stronger LNAPL gradient or continuing LNAPL source. As a result, LNAPL bodies will eventually become spatially stable under prevailing conditions even though LNAPL exceeding residual saturation may remain in the core of the LNAPL body. LNAPL bodies typically stabilize after the release stops and the driving force (head) dissipates.
The smearing of LNAPL due to water table fluctuations will redistribute the LNAPL mass so that it becomes progressively less mobile and recoverable over time. For example, in a rising and subsequent falling water table in an unconfined condition: the mobile fraction of the LNAPL will move up with the water table during the rise (Figure 5), but some portion of this mobile fraction will become trapped in the pore space when the water table drops. Therefore, the vertical LNAPL distribution changes and the mobile fraction that remains afterwards are smaller. Seasonal fluctuations in the water table that redistribute the mobile LNAPL fraction, together with biodegradation, dissolution, and volatilization that deplete LNAPL mass, decrease the fraction of mobile LNAPL over time until all LNAPL exists as residual.
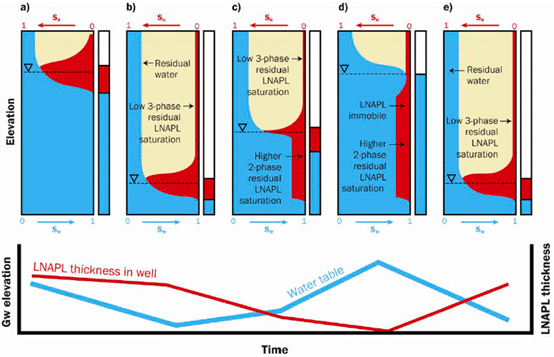

Figure 5. Conceptual depiction of LNAPL observed within the formation and within monitoring wells (a – e) during a variable water table and LNAPL thickness shown on the bottom graph (ITRC 2009)
The apparent thickness in the well is commonly exaggerated compared to the thickness of the mobile LNAPL interval in the formation as discussed below for unconfined, confined, perched, and fractured bedrock settings.
Unconfined Conditions
Confined Conditions
Perched Conditions
Fractured Preferential Pathway Conditions

Figure 6: Scenarios of finding LNAPL in the monitoring well at different geological condition
In general, if LNAPL does not collect in properly constructed and properly located monitoring wells during periods of low water table conditions, mobile LNAPL is likely not present at the spill site, and any LNAPL present should be considered immobile residual product. If LNAPL does collect in a monitoring well, LNAPL is potentially mobile in the soil near the monitoring well, but the LNAPL plume or plume body may or may not be mobile or migrating at a site scale. Temporal gauging of monitoring wells with screened intervals bridging the water table within the LNAPL body and at the plume fringes is one of the most useful tools for determining whether mobile LNAPL is present at a site and if the LNAPL body is migrating on a site scale.
The LNAPL that is observed in collection points is the result of LNAPL draining from pores in the immediate vicinity of the collection point. LNAPL can drain into a collection point either naturally or due to engineered controls such as pumping, to the extent that it remains mobile in the area of the collection point. Once the residual saturation is reached, further hydraulic recovery, in the liquid phase without altering the chemical or physical properties of the residual LNAPL, will not be possible. The residual saturation is a theoretical endpoint for pumping-based recovery systems that will not likely be achieved on a field-scale. At residual saturation, the LNAPL cannot move unless the chemical or physical properties of the LNAPL are altered by other LNAPL remediation technologies.
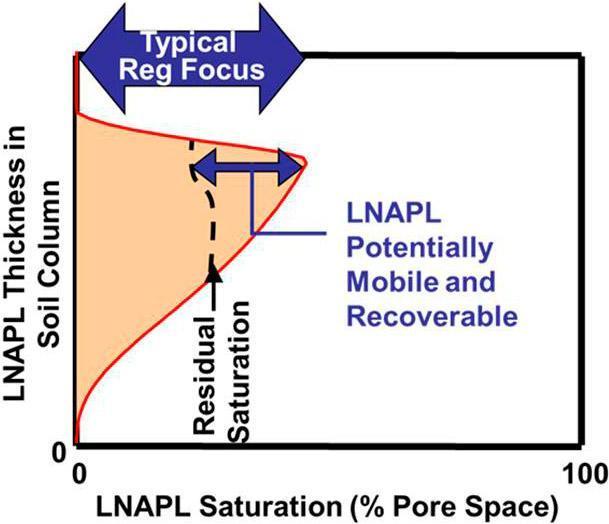

Figure 7: The residual saturation is a theoretical endpoint for pumping-based recovery systems that will not likely be achieved on a field-scale.
LNAPL Indicators
At petroleum release sites where an LNAPL concern exists, but it has not been directly observed, a determination of LNAPL presence should rely on multiple lines of evidence to verify or eliminate the suspected LNAPL concern. Monitoring for the presence or absence of LNAPL in monitoring wells can be helpful; however, it should not be the only assessment tool. Where LNAPL is present in a properly constructed monitoring well, LNAPL can also be assumed present in the surrounding subsurface formation. However, it is a common misconception to assume that if no LNAPL is present in a monitoring well, then there is no LNAPL in the soil. Similarly, if in-well LNAPL thickness changes from measurable to not measurable following LNAPL remediation, it is a common misconception to assume that LNAPL is no longer present within the surrounding subsurface soil. In both of these scenarios, LNAPL may be present in discontinuous pores at saturations less than those needed to migrate laterally or to mobilize into a monitoring well.
Table 1 lists potential indicators of the presence of LNAPL in unconsolidated materials, and more importantly, also cautions the use of indicators that should be viewed as ‘lines of evidence’ rather than absolute indicators.
Table 1. Potential LNAPL Indicators
| Indicator | Limitations |
| Groundwater | |
| ∙ Effective solubility of a given constituent:Greater than 1% to 10% (e.g., for gasoline) | There is not a specific petroleum hydrocarbon compound (PHC) concentration in groundwater that defines LNAPL because of varying product types and degrees of weathering. |
| ∙ Benzene: > 1 – 5 mg/L | |
| ∙ TPH(gasoline): > 30 mg/L | |
| ∙ BTEX: > 20 mg/L5 | |
| ∙ Current or historical presence of LNAPL (including sheens) | |
| Soil | |
| ∙ Current or historical presence of LNAPL (including sheens, staining) | ∙ The use of TPH soil concentration data as LNAPL indicators should be exercised with caution. Note that the information in this table may not be applicable to media such as sediment or fractured media. |
| ∙ Benzene > 10 mg/kg2 | ∙ TPH soil concentrations can be affected by the presence of soil organic matter. |
| ∙ TPH (gasoline) > 250 – 500 mg/kg2,5 | ∙ TPH soil concentrations are not well correlated with TPH or O2 soil gas concentrations (Lahvis and Hers 2013). |
| ∙ TPH (diesel): > 10 – 30 mg/kg | ∙ Organic vapor readings are composition dependent. For older (weathered) releases, LNAPL may be present at much lower PID/FID readings. |
| ∙ Ultraviolet fluorescence (UV) or LIF response in LNAPL range | |
| ∙ PID or FID readings for a recent release > 500 ppm | |
| Location Relative to Release Area | |
| ∙ Adjacent to (e.g., within 20 feet of) a known or suspected LNAPL release area or petroleum equipment | ∙ The probability of encountering LNAPL increases closer to a known or suspected release. |